
Comparing acoustic data from different panel suppliers is a headache. You see good numbers but get bad noise on the ship. Let me show you how to read these charts.
To compare acoustic data across marine accommodation panel suppliers accurately, you must align three critical metrics: the specific ISO testing standard used, the exact frequency range (typically 100Hz to 3150Hz) measured, and the mounting method employed during the acoustic lab test.
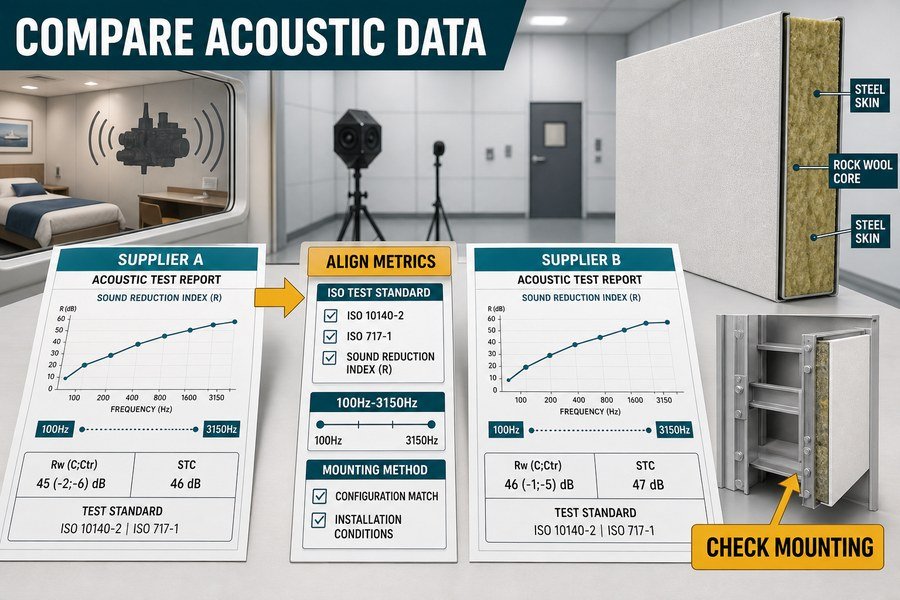
When you buy panels in Asia for strict US and EU shipyards, a small mistake in reading data costs you money and reputation. Let us look at how you can strip away the marketing tricks and find the real numbers.
How to Make Apples-to-Apples STL Comparisons Between Marine Accommodation Panel Factories?
You look at two quotes. Both claim excellent Sound Transmission Loss (STL). But without knowing how they tested, you might buy a loud panel. Here is the fix.
To make true apples-to-apples STL comparisons between marine panel factories, you must verify four factors: matching ISO 10140 testing standards, identical panel core densities, identical panel thicknesses, and testing across the exact same 1/3 octave band frequency range from 100Hz to 3150Hz.
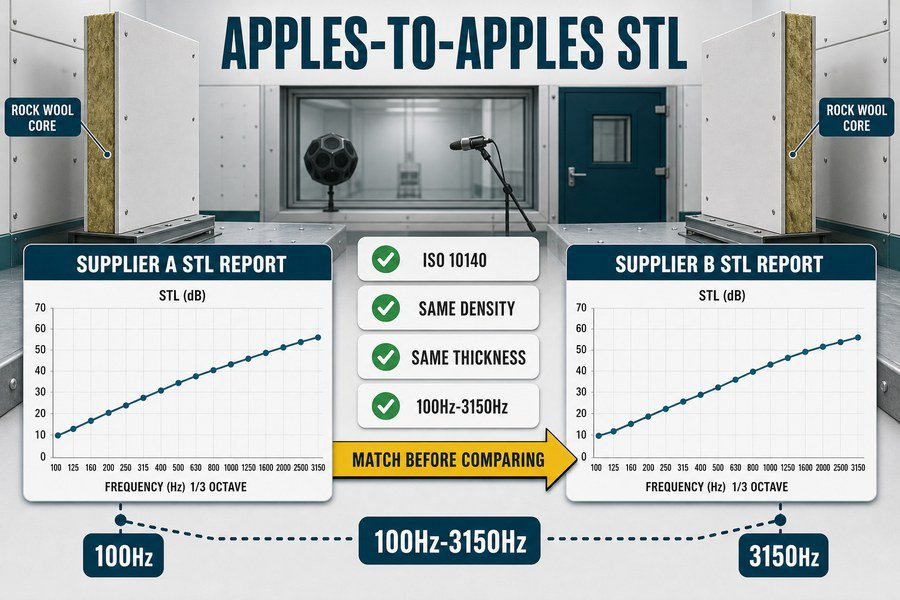
In my early days at the marine outfitting factory, I saw buyers make a simple mistake. They looked only at the final number. They ignored how the factory got that number. To make a real comparison, you must look at four specific factors in the test reports.
Standardizing ISO 10140 Test Methods and Frequency Bands for Marine Panels
First, you must check the testing standard. The global standard for acoustic testing is ISO 10140.1 If Factory A uses ISO 10140 and Factory B uses an old national standard, you cannot compare their numbers. The test rooms have different sizes and different microphones.
Second, you must check the frequency range. A proper test measures sound across the exact same 1/3 octave band frequency range. This range must go from 100Hz to 3150Hz. Some factories only test from 500Hz to 2000Hz. This hides their bad performance at low frequencies. If the ranges do not match, the final STL number is a lie.
Aligning Physical Marine Panel Specifications: Density and Thickness
Third, you must compare identical panel core densities. Rockwool is the most common core for marine accommodation panels.2 If you compare a panel with 120kg/m³ rockwool to a panel with 150kg/m³ rockwool, the heavier panel will stop more sound3. The difference can be 2dB to 3dB.
Fourth, you must ensure identical panel thicknesses. A 50mm thick wall panel will always perform better than a 25mm thick ceiling panel. When you ask suppliers for data, always tell them the exact thickness and density you want. If they send data for a 75mm panel when you want a 50mm panel, ask them to test again.
| Comparison Factor | Correct Method for Apples-to-Apples | Incorrect Method (Do Not Accept) | Result of Incorrect Method |
|---|---|---|---|
| Test Standard | ISO 10140 for both factories | ISO 10140 vs. old local standard | Data is completely incompatible |
| Frequency Range | 100Hz to 3150Hz in 1/3 octave bands | 500Hz to 2000Hz | Hides low engine noise performance |
| Core Density | Compare 150kg/m³ to 150kg/m³ | Compare 120kg/m³ to 150kg/m³ | Heavier core wins unfairly |
| Panel Thickness | Compare 50mm to 50mm | Compare 25mm to 50mm | Thicker panel wins unfairly |
Which Structural Variables Skew Competing Marine Wall Panel Rw Comparisons?
A supplier gives you an Rw (Weighted Sound Reduction Index) number of 45dB. You install it, and it fails shipyard inspection. What went wrong? Hidden structural variables skewed the data.
Three main structural variables skew marine wall panel Rw comparisons: varying steel skin thicknesses (from 0.6mm to 1.0mm), different core material densities (like 120kg/m³ versus 150kg/m³ rockwool), and the presence or absence of internal acoustic damping foils.
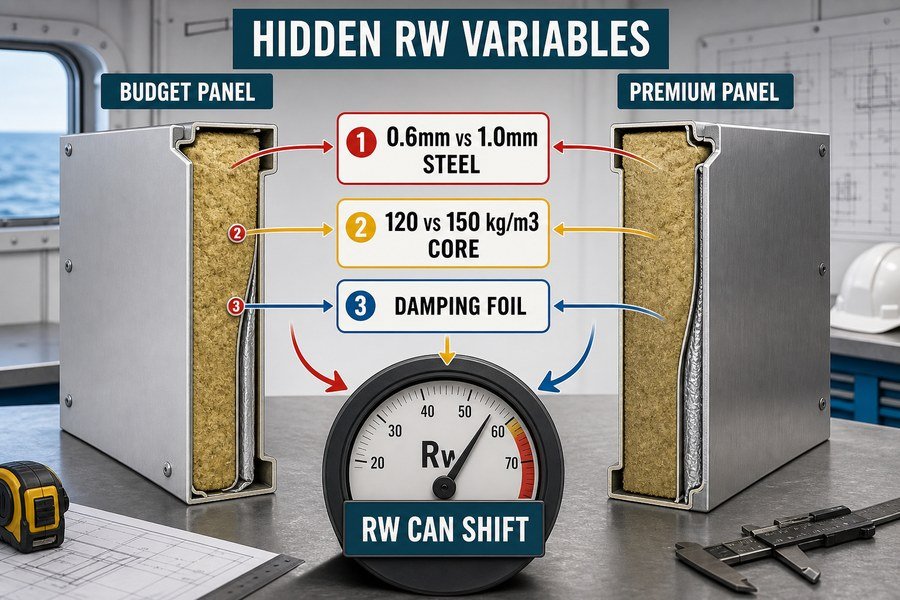
Many procurement officers think all 50mm rockwool panels are the same. This is not true. At Magellan Marine, we see how small structural changes make big differences in the sound lab. When you compare Rw values from two Asian factories, you must look inside the panel. Three main variables change the test results.
Impact of Steel Skin Thickness on Marine Panel Rw Ratings
The first variable is the varying steel skin thicknesses. Standard marine wall panels use galvanized steel skins. A cheap supplier might use a 0.6mm steel skin. A high-quality supplier might use a 0.8mm or 1.0mm steel skin. Thicker steel adds mass. In acoustics, mass blocks sound.4 Changing the steel skin from 0.6mm to 1.0mm can increase the Rw value by 1dB to 2dB.5 If you compare a 0.6mm panel to a 1.0mm panel, the 1.0mm panel will always look better on paper. You must ask the factory to declare their skin thickness on the quotation.
Core Material Densities and Internal Acoustic Foils in Marine Panels
The second variable is the different core material densities. Rockwool comes in different weights. The most common are 120kg/m³ and 150kg/m³. A 150kg/m³ core is much denser. It absorbs more sound waves.6 If Factory A uses 120kg/m³ and Factory B uses 150kg/m³, Factory B will have a higher Rw number.
The third variable is the presence or absence of internal acoustic damping foils. Some premium panels have a thin, heavy foil glued between the steel skin and the rockwool. This foil stops the steel from vibrating.7 It is a secret weapon for high acoustic ratings. It can add 3dB to the final Rw score. If you do not know about this foil, you will think the standard panel is just bad.
| Structural Variable | Budget Panel Specification | Premium Panel Specification | Estimated Rw Change |
|---|---|---|---|
| Steel Skin Thickness | 0.6mm PVC coated steel | 0.8mm to 1.0mm galvanized steel | +1dB to +2dB for premium |
| Core Material Density | 120kg/m³ Rockwool | 150kg/m³ or 175kg/m³ Rockwool | +2dB to +3dB for premium |
| Acoustic Damping Foil | None (Absent) | Heavy mass foil included | +2dB to +4dB for premium |
Why Might a Cheap 44dB Rw Marine Accommodation Panel Perform Worse than a Premium 42dB One?
A cheap panel shows 44dB on paper. A premium panel shows 42dB. You buy the 44dB one to save money, but the cabin is noisy. Why does this happen?
A cheap 44dB Rw marine panel often performs worse than a premium 42dB one due to two major flaws: poor low-frequency sound isolation (below 250Hz) masked by high-frequency peaks, and inconsistent manufacturing tolerances that leave sound-leaking gaps during actual shipyard installation.
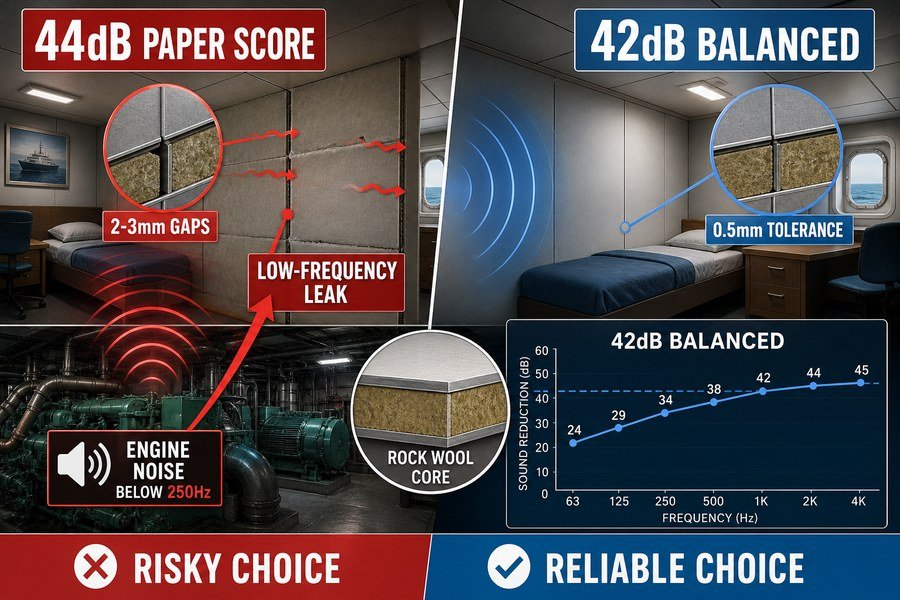
This is the most common trap for buyers. The Rw number is just a single-number average.8 It does not tell the whole story. I have helped many clients who bought cheap 44dB panels, only to face heavy penalties from EU shipyards because the cabins were too loud. There are two major reasons why this happens in real life.
Low-Frequency Sound Isolation Weaknesses in Cheap Marine Panels
The first reason is poor low-frequency sound isolation below 250Hz. The Rw calculation averages out different frequencies. A cheap panel might be very good at blocking high-frequency noise, like voices at 1000Hz or 2000Hz. This high performance pulls the total Rw number up to 44dB. However, ship engines and generators produce low-frequency noise, usually between 63Hz and 250Hz9. The cheap panel might completely fail at these low frequencies, blocking only 20dB. The premium 42dB panel might be very balanced. It might block 35dB at low frequencies and 45dB at high frequencies. On a ship, the balanced 42dB panel will feel much quieter than the cheap 44dB panel.
How Manufacturing Tolerances Create Sound Leaks in Marine Cabins
The second reason is inconsistent manufacturing tolerances. Lab tests use perfect panels assembled by engineers. But what happens at the shipyard? Cheap factories use old cutting machines. Their panel edges might have a 2mm or 3mm size error. When workers install these panels on the ship, they do not fit tightly. Gaps appear in the joints. Sound acts like water; it flows through the smallest hole. A 1mm gap between two panels can drop the real-world acoustic performance by 5dB to 10dB.10 Premium factories use CNC machines with 0.5mm tolerances. Their panels click together perfectly, leaving no gaps.
| Acoustic Factor | Cheap 44dB Panel | Premium 42dB Panel | Real-World Shipyard Result |
|---|---|---|---|
| Low-Frequency (125Hz) | Blocks only 22dB | Blocks 34dB | Premium panel stops engine noise better. |
| High-Frequency (2000Hz) | Blocks 55dB (inflates Rw) | Blocks 48dB | Both stop voices well, but cheap panel hides its flaw. |
| Joint Tolerance | 2.0mm to 3.0mm error | 0.5mm error | Cheap panel leaves gaps; sound leaks through walls. |
What Red Flags Indicate Inflated Marine Accommodation Panel STL Claims?
You need high quality, but some suppliers fake their data to get your order. If you present this data to EU shipyards, you lose the contract. Learn the warnings.
Three red flags indicate inflated marine panel STL claims: using theoretical calculated values instead of actual lab tests, omitting the ISO 717-1 standard reference curve on the test report, and testing single frequencies instead of the full acoustic spectrum.
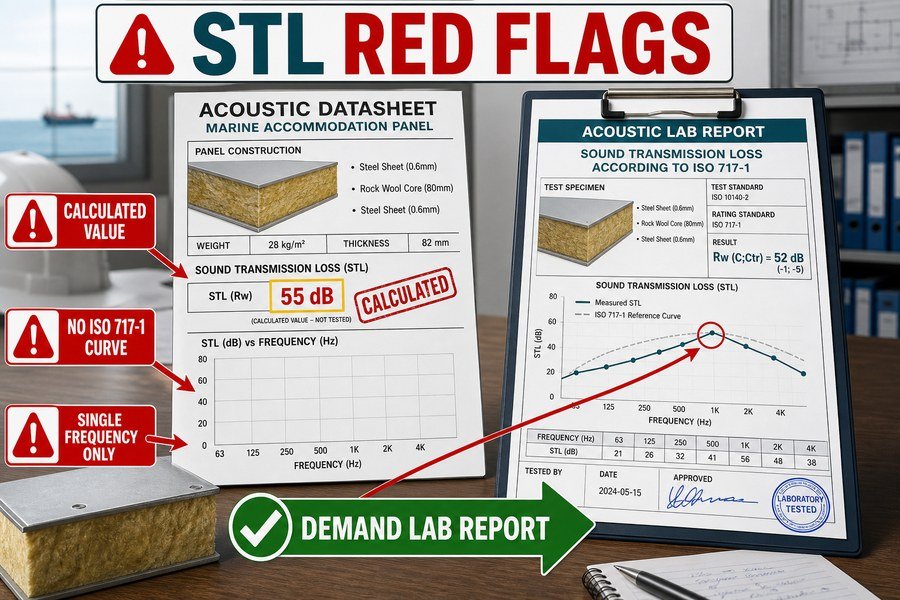
When a factory from an emerging market sends you a very cheap price and very high acoustic data, you must be careful. I have read hundreds of test reports. Many of them are not honest. To protect your projects, you need to read the test report carefully. Look for these three clear red flags.
Spotting Theoretical Acoustic Values vs. Actual Marine Lab Tests
The first red flag is using theoretical calculated values instead of actual lab tests11. Acoustic lab tests are expensive. A proper test in an SGS or Intertek lab costs about $3,000 to $5,000 USD. To save money, some factories use software to guess their acoustic performance. They write "Calculated Rw = 45dB" on their brochure. This is a big warning. A computer calculation does not account for weak glue, bad edge bending, or poor rockwool distribution. You must demand a physical test report signed by a laboratory manager.
Missing ISO 717-1 Reference Curves and Single Frequency Tricks in Marine Reports
The second red flag is omitting the ISO 717-1 standard reference curve on the test report. A real acoustic report always shows a graph. This graph has a jagged line showing the actual test results, and a smooth reference curve defined by ISO 717-1. The Rw value is calculated by matching these two lines.12 If the report only gives you a number and hides the graph, they are hiding bad data.
The third red flag is testing single frequencies instead of the full acoustic spectrum. Sometimes, a factory will blast a 1000Hz tone at the panel, record a 48dB drop, and tell you their panel is 48dB. This is fake. Real marine noise covers a full spectrum. The test must measure every 1/3 octave band from 100Hz up to 3150Hz.
| Red Flag on Data Sheet | What the Factory Did | What You Should Do | Risk to Your Project |
|---|---|---|---|
| Mentions "Calculated Value" | Used software instead of a real lab test. | Demand a physical lab test report. | Panel fails actual noise tests on the ship. |
| No Graph or Curve Shown | Hid the poor performance at specific frequencies. | Ask for the full ISO 717-1 curve graph. | Shipyard rejects the material submittal. |
| Lists only one Hz value | Tested one tone where the panel performs best. | Demand 100Hz to 3150Hz full spectrum data. | Complete failure to block real engine noise. |
How to Verify if Two Suppliers Used Identical Marine Accommodation Panel Edge Mountings?
The way a panel connects to the test frame changes the result by 3 to 5 decibels. If you do not check the edge mounting, your comparison is useless.
To verify if two suppliers used identical marine panel edge mountings, you must check the test report photos for three mounting details: rigid versus flexible frame connections, the exact type of acoustic sealants applied to the joints, and the spacing of fixing profiles.
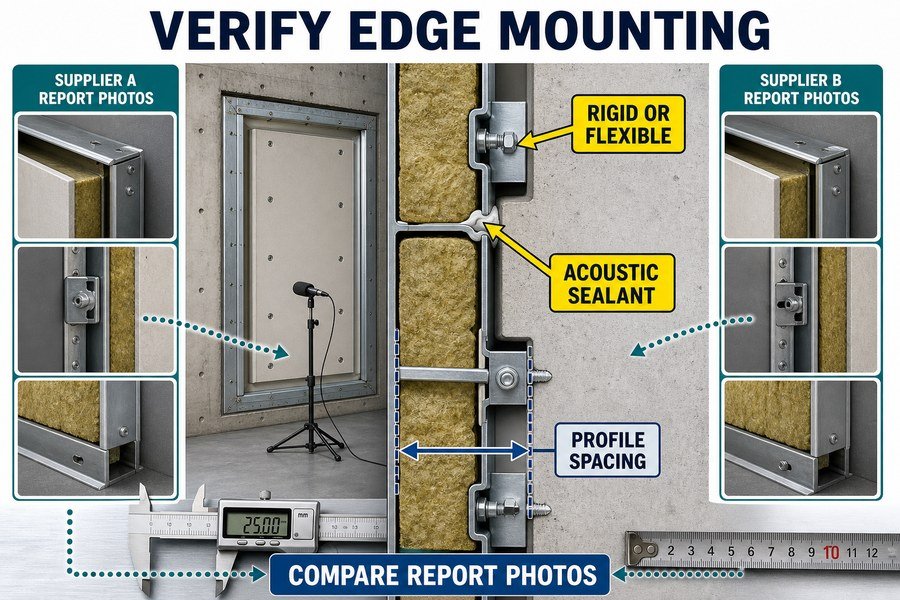
Many people only read page one of the acoustic report. They see the Rw number and close the PDF. This is a mistake. You must scroll down to the photos and diagrams. How the factory mounted the panel in the lab makes a huge difference. If two factories used different mounting methods, their data cannot be compared.13 You must check three specific details.
Checking Rigid vs. Flexible Test Frame Connections in Marine Reports
The first detail is rigid versus flexible frame connections. In the lab, the panel is built into a large opening in a concrete wall. Factory A might screw their panel directly into the concrete. This is a rigid connection. Sound travels through the screws. Factory B might place a 10mm rubber pad between their panel and the concrete. This is a flexible connection. The rubber stops the sound vibration. Factory B will get an Rw score that is 2dB to 4dB higher, just because they used rubber in the lab.14 You must look at the cross-section drawing in the report to see if they used rubber or not.
Analyzing Acoustic Sealants and Fixing Profile Spacing
The second detail is the exact type of acoustic sealants applied to the joints. During a test, even a tiny air leak destroys the score. Factories will use silicone or fire-resistant acoustic mastic to seal the edges of the panel. You must read the test description to see how much sealant they used. If they used sealant in the lab, you must use the same sealant during shipyard installation to get the same result.
The third detail is the spacing of fixing profiles. The metal tracks that hold the panels together are important. If Factory A places fixing profiles every 300mm and Factory B places them every 600mm, the panel stiffness changes. You must find the text that describes the mounting frame and compare the profile spacing.
| Mounting Detail to Check | High Acoustic Score Method | Standard Shipyard Method | Impact on Data Comparison |
|---|---|---|---|
| Frame Connection | Rubber pads (Flexible) | Direct steel screws (Rigid) | Flexible method artificially inflates Rw by ~3dB. |
| Edge Sealant | Heavy acoustic silicone | Standard joint profiles | Heavy silicone hides bad joint designs. |
| Profile Spacing | Wide spacing (600mm) | Tight spacing (300mm) | Wide spacing reduces metal-to-metal sound bridges. |
Why Demand Third-Party Reports Over Marine Accommodation Panel Factory Self-Declarations?
A factory hands you a paper saying their panel is perfect. The price is great. But without a third-party check, you carry all the risk. Demand real proof.
You must demand third-party reports over marine panel factory self-declarations for three reasons: to ensure compliance with strict IMO A.468(XII) noise regulations, to guarantee the calibration of testing equipment, and to prevent shipyard rejection of undocumented materials which causes massive project delays.
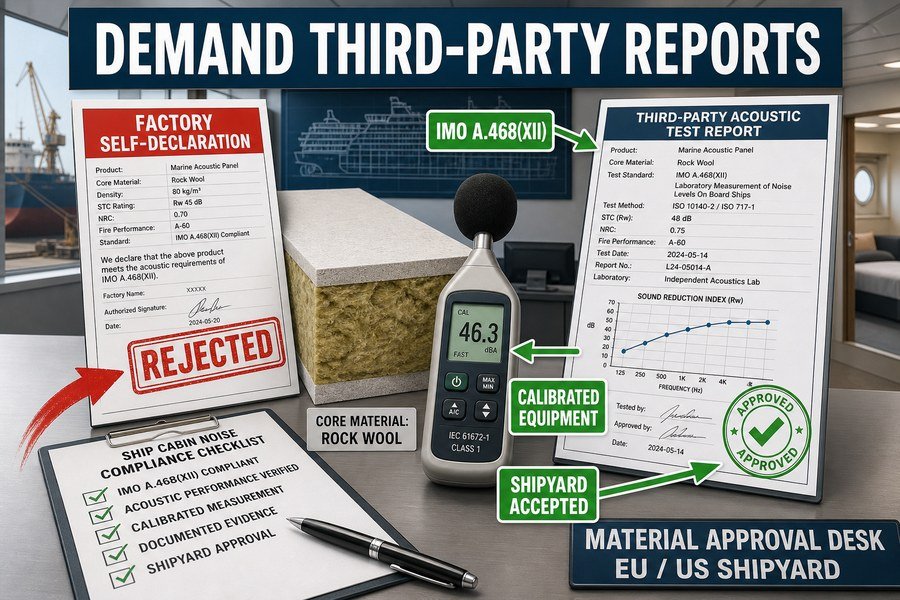
When you do interior decoration projects for large shipyards in Europe and the United States, paper is just as important as the product. A cheap panel with bad paperwork is worthless. I always advise my clients to reject factory self-declarations15. You must insist on reports from global labs like DNV, SGS, or Intertek. There are three clear reasons why this is mandatory.
Meeting IMO A.468(XII) Marine Noise Level Regulations
The first reason is to ensure compliance with strict IMO A.468(XII) noise regulations. The International Maritime Organization has very strict rules for noise levels in crew and passenger cabins. For example, a sleeping cabin must not exceed 60dB(A). Western shipyards check this strictly before delivering the ship. A third-party lab understands these IMO rules and tests the panels according to maritime standards. A factory self-declaration often ignores IMO rules and uses simple building standards. If you use non-IMO data, the shipyard will stop your project.
Equipment Calibration and Preventing Costly Shipyard Rejections
The second reason is to guarantee the calibration of testing equipment. Acoustic microphones and sound level meters must be calibrated every year.16 Third-party labs spend thousands of dollars maintaining their equipment. A small factory might use an uncalibrated meter they bought five years ago. Their data is not accurate.
The third reason is to prevent shipyard rejection of undocumented materials which causes massive project delays. European and American shipyards have strict quality control systems.17 When you submit your materials for approval, the shipyard engineer will check the source of the data. If they see a factory self-declaration, they will reject it immediately. This rejection will force you to stop installation, find a new supplier, and lose weeks of time. A $4,000 third-party test report saves you $50,000 in delay penalties.
| Document Type | Equipment Accuracy | IMO Rule Compliance | Shipyard Acceptance Rate |
|---|---|---|---|
| Factory Self-Declaration | Unverified, often uncalibrated | Usually ignores maritime rules | Near 0% in EU/US shipyards |
| Third-Party Report (e.g., SGS) | Calibrated and certified yearly | Strictly follows IMO A.468(XII) | 100% acceptance globally |
Conclusion
Comparing acoustic data requires digging into test methods, structural variables, and third-party validation. Always read the fine print to protect your projects, satisfy shipyard rules, and secure your profit margins.
-
"Sound insulation dataset of 30 wooden and 8 concrete floors ...", https://pmc.ncbi.nlm.nih.gov/articles/PMC10365936/. ISO 10140 specifies laboratory methods for measuring sound insulation of building elements, providing the standardized framework used to report airborne sound insulation under controlled conditions. Evidence role: definition; source type: institution. Supports: ISO 10140 is a globally recognized standard for acoustic testing.. Scope note: This supports ISO 10140 as an international laboratory standard for acoustic testing, but not necessarily as the exclusive standard used in every jurisdiction or marine procurement context. ↩
-
"How to choose the right marine wall panels for marine interior projects?", https://magellanmarinetech.com/how-choose-right-marine-wall-panels-for-marine-interior-projects/. Technical and classification-society materials on ship accommodation fire and acoustic insulation commonly identify mineral wool, including rock wool, as a standard core or insulation material for marine interior panels. Evidence role: general_support; source type: institution. Supports: Rockwool is commonly used as a core material for marine accommodation panels.. Scope note: This would support the common use of rock wool/mineral wool in marine accommodation construction, but may not quantify market share or prove it is the single most common core globally. ↩
-
"[PDF] Ultrasonic, Normal-Incidence Insertion Loss through Common Building ...", https://physics.byu.edu/docs/thesis/269. The mass law of sound insulation states that, for many partitions in the stiffness- and mass-controlled frequency range, increasing surface mass generally increases transmission loss, explaining why otherwise similar heavier panels may show higher sound reduction. Evidence role: mechanism; source type: education. Supports: For otherwise comparable panels, higher density or mass can improve sound transmission loss.. Scope note: The relationship is frequency-dependent and can be affected by panel construction, resonances, cavity effects, and mounting conditions, so it is not an unconditional guarantee for every marine panel. ↩
-
"[PDF] Sound transmission loss characteristics of sandwich panel ...", https://bulldog2.redlands.edu/fac/julie_rathbun/physclasses/sound.pdf. Acoustic mass-law treatments state that, for limp or single-leaf barriers over the mass-controlled frequency range, transmission loss generally increases with surface mass and frequency. Evidence role: mechanism; source type: education. Supports: Greater panel mass tends to improve airborne sound insulation.. Scope note: This is a general acoustic principle; real sandwich panels can deviate because stiffness, resonances, seams, and mounting details also affect Rw. ↩
-
"How to choose the right marine wall panels for marine interior ...", https://magellanmarinetech.com/how-choose-right-marine-wall-panels-for-marine-interior-projects/. Published sound-transmission studies and mass-law calculations support that increasing a panel skin’s surface mass can raise sound reduction, with the expected change depending on frequency range and panel construction. Evidence role: general_support; source type: paper. Supports: Increasing steel skin thickness from 0.6 mm to 1.0 mm can modestly increase Rw.. Scope note: A neutral source is likely to support the direction and approximate mechanism rather than prove the exact 1–2 dB increase for this specific marine panel design. ↩
-
"Characterization of Sheep Wool as a Sustainable Material for Acoustic ...", https://pmc.ncbi.nlm.nih.gov/articles/PMC5706224/. Studies of mineral wool and fibrous absorbers show that density and airflow resistivity influence sound absorption and sound transmission performance in layered constructions. Evidence role: mechanism; source type: paper. Supports: A denser rockwool core can improve acoustic absorption or sound insulation performance in a panel assembly.. Scope note: Higher density does not always mean higher absorption at every frequency or thickness; the result depends on airflow resistivity, cavity depth, compression, and the full panel assembly. ↩
-
"[PDF] Vibro-acoustical analysis and design of a multiple-layer constrained ...", https://digitalcommons.mtu.edu/cgi/viewcontent.cgi?article=1382&context=etds. Research on constrained-layer and viscoelastic damping shows that adding damping layers to sheet-metal structures can reduce vibration amplitudes and radiated sound, thereby improving acoustic performance in some assemblies. Evidence role: mechanism; source type: paper. Supports: An internal acoustic damping foil can reduce vibration of steel skins in a panel.. Scope note: This supports the damping mechanism, not the exact performance of any proprietary foil or a guaranteed Rw increase for all marine panels. ↩
-
"Sound reduction index - Wikipedia", https://en.wikipedia.org/wiki/Sound_reduction_index. ISO 717-1 defines the weighted sound reduction index, Rw, as a single-number rating derived from frequency-band sound reduction measurements. Evidence role: definition; source type: institution. Supports: Rw is a single-number acoustic rating rather than a full frequency-by-frequency description.. Scope note: This supports the definition of Rw, but not the article’s specific comparison between the 44 dB and 42 dB panels. ↩
-
"[PDF] Vessel-Generated Underwater Radiated Noise Comparison Study ...", https://www.maritime.dot.gov/sites/marad.dot.gov/files/2024-11/NCE%20REPORT%202024-079%20MARAD%20Vessel-Generated%20Underwater%20Radiated%20Noise%20Comparison%20Study%20%28Tugs%29%20Rev%200.pdf. Studies of shipboard machinery noise commonly report substantial energy in low-frequency octave bands, including the 63 Hz, 125 Hz, and 250 Hz bands associated with engines and generators. Evidence role: general_support; source type: paper. Supports: Ship engines and generators are important sources of low-frequency noise in the 63–250 Hz range.. Scope note: The exact frequency distribution varies by vessel type, machinery, mounting, and operating condition. ↩
-
"[PDF] Investigation of transmission loss through double wall structures with ...", https://ir.library.louisville.edu/cgi/viewcontent.cgi?referer=&httpsredir=1&article=2758&context=etd. Building-acoustics research on airborne sound insulation shows that small unsealed gaps and leakage paths can substantially reduce the measured sound reduction of partitions. Evidence role: mechanism; source type: paper. Supports: Small gaps between panels can significantly reduce real-world sound insulation performance.. Scope note: A precise 5–10 dB loss from a 1 mm gap depends on the panel system, gap length, frequency range, and installation geometry. ↩
-
"Sound insulation dataset of 30 wooden and 8 concrete floors ...", https://pmc.ncbi.nlm.nih.gov/articles/PMC10365936/. ISO laboratory sound-insulation standards distinguish measured airborne sound-insulation performance from ratings or predictions, supporting the need to verify acoustic claims with physical test data rather than calculations alone. Evidence role: expert_consensus; source type: institution. Supports: The article claims that theoretical calculated acoustic values are a red flag compared with actual laboratory tests.. Scope note: This supports the preference for standardized measurement but does not show that every calculated value is inaccurate. ↩
-
"Sound reduction index - Wikipedia", https://en.wikipedia.org/wiki/Sound_reduction_index. ISO 717-1 defines the weighted sound reduction index by comparing measured one-third-octave sound-reduction values with a standard reference curve, supporting the description of Rw as a curve-fitting rating rather than a single-frequency result. Evidence role: definition; source type: institution. Supports: The article claims that Rw is obtained by matching measured acoustic data to the ISO 717-1 reference curve.. Scope note: Access to the full ISO standard may be restricted; secondary institutional summaries may be needed to verify the procedure without reproducing the standard text. ↩
-
"Validation of a 1:8 Scale Measurement Stand for Testing ...", https://pmc.ncbi.nlm.nih.gov/articles/PMC8512408/. Acoustic test standards require specified and reported installation conditions so that sound insulation results are reproducible and comparable between laboratories or specimens. Evidence role: expert_consensus; source type: institution. Supports: Rw data from panels tested with different mounting methods may not be directly comparable.. Scope note: A standard can support the need for comparable test conditions, but it does not prove that every difference in mounting makes all data unusable. ↩
-
"[PDF] Chapter 6 Transmission Loss Tests 6.1 Test Setup - VTechWorks", https://vtechworks.lib.vt.edu/bitstream/handle/10919/31833/Chapter6.pdf. Research on resilient layers and vibration isolation supports the mechanism that elastomeric or resilient connections can reduce structure-borne transmission and improve measured sound insulation; any cited value should be treated as system-specific rather than a universal 2–4 dB increase. Evidence role: mechanism; source type: paper. Supports: Using rubber or resilient pads in a test frame can increase measured Rw compared with a rigid connection.. Scope note: The exact 2–4 dB improvement depends on panel mass, fastener design, rubber stiffness, frequency range, and test configuration. ↩
-
"Complying with the resource requirements of ISO/IEC 17025 ...", https://pmc.ncbi.nlm.nih.gov/articles/PMC9579603/. ISO/IEC 17025 establishes competence, impartiality, and traceability requirements for testing laboratories, providing a standards basis for preferring accredited third-party test reports over unsupported supplier declarations for technical measurements. Evidence role: expert_consensus; source type: institution. Supports: Independent accredited laboratory reports provide stronger evidentiary value than unsupported factory self-declarations for acoustic performance data.. Scope note: ISO/IEC 17025 supports laboratory competence and traceable testing, but it does not by itself prove that every shipyard rejects all factory self-declarations. ↩
-
"Metrological Traceability: Frequently Asked Questions and ...", https://www.nist.gov/metrology/metrological-traceability. International sound-level-meter standards and acoustics guidance require periodic verification or calibration of measurement instruments to maintain measurement traceability; many accreditation and measurement programs use annual calibration intervals as common practice. Evidence role: mechanism; source type: paper. Supports: Reliable acoustic testing depends on regular calibration of microphones and sound-level meters, commonly on an annual schedule.. Scope note: The source may support periodic or traceable calibration generally rather than a universal legal requirement for every microphone and sound-level meter in every jurisdiction. ↩
-
"Ship classification society - Wikipedia", https://en.wikipedia.org/wiki/Ship_classification_society. Classification-society and maritime quality-assurance rules require documented verification, inspection, and certification of materials and equipment during ship construction, supporting the general claim that major shipyards operate formal quality-control and approval systems. Evidence role: general_support; source type: institution. Supports: Shipyards commonly use formal material approval and quality-control documentation processes during vessel construction.. Scope note: This would support the existence of formal quality-control processes, not the article’s stronger claims that self-declarations are always rejected or that acceptance rates are 0% or 100%. ↩