
Ship noise ruins passenger comfort. Choosing panels blindly leads to failed inspections and costly rework. I will show you exactly how to read STL curves to pick the right panels.
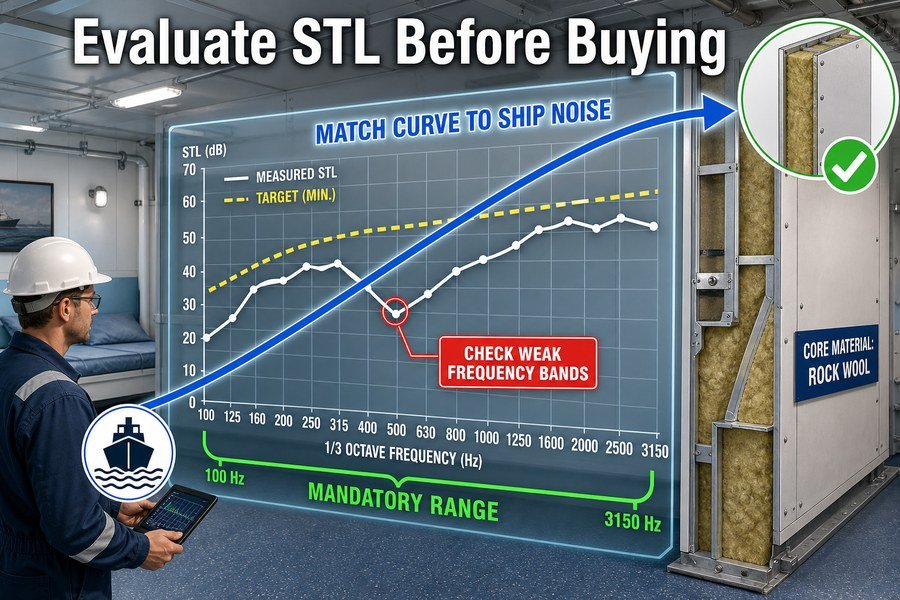
Engineers evaluate a marine accommodation panel STL curve by analyzing its 1/3 octave graph, checking core density correlation, identifying weak frequency bands, preferring flat over peaked curves, matching it to the ship's specific noise spectrum, and ensuring it covers the mandatory 100 Hz to 3150 Hz frequency range.
Sound Transmission Loss (STL) curves look complex, but they are just simple roadmaps to a quieter ship. If you do not understand these charts, you might buy a panel that blocks the wrong kind of noise and wastes your budget. Let us break down each part of this evaluation process together so you can make smart purchasing choices.
How to Read a 1/3 Octave STL Graph for a Marine Accommodation Panel?
Staring at jagged graph lines is confusing. Misreading them means you buy panels that fail acoustical tests. I will explain how to read the X and Y axes easily.
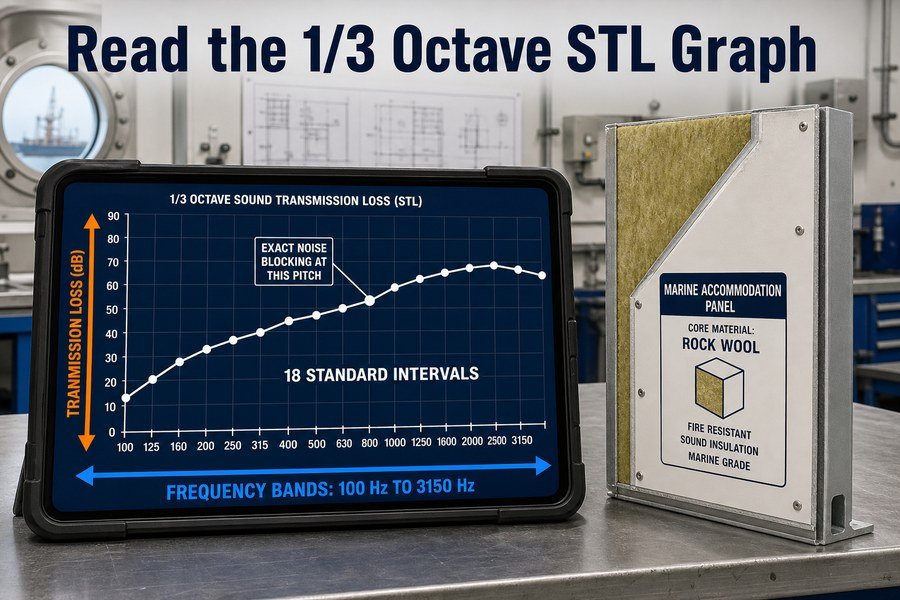
To read a 1/3 octave STL graph, you must map the X-axis for frequency bands (pitch in Hertz), read the Y-axis for transmission loss (noise reduction in Decibels), and track the plotted curve to determine exact noise blocking capacity at 18 standardized intervals.
Understanding the X-Axis Frequency Bands in Hertz
The X-axis runs along the bottom of the graph. It shows the frequency of the sound, measured in Hertz (Hz). This is simply the pitch of the noise. According to ISO 717-1 acoustic standards, marine panels are tested using 1/3 octave bands. This means the testing lab cuts the sound spectrum into smaller, standard slices. There are exactly 18 standard frequency bands on this axis.1 They start low at 100 Hz, which sounds like a deep engine rumble. They go up to 3150 Hz, which sounds like a high-pitched air vent hiss. You must look at this axis to know what kind of noise the panel faces.
Reading the Y-Axis Transmission Loss in Decibels
The Y-axis goes up the side of the graph. It measures the Sound Transmission Loss (STL) in decibels (dB).2 This number tells you exactly how much noise the panel blocks. A higher number is always better. For example, a standard 50mm rockwool marine wall panel typically blocks 35 dB at 500 Hz, based on factory test reports. If the ship's engine room makes 90 dB of noise, a 35 dB loss means the cabin next door will only hear 55 dB.3 You must read this axis to prove your panel meets the shipyard's strict acoustic rules.
Tracking the Plotted Curve Across the 18 Intervals
The line drawn on the graph is the actual STL curve. It connects the data points for all 18 standard frequency bands. You must trace this line carefully from left to right. It will show you the panel's performance at every single pitch. You cannot just look at the overall average number on the test report cover. You must follow the curve to see if the line drops suddenly at a specific point, which means the panel fails to block noise at that specific pitch.
| Graph Component | Measurement Unit | What It Tells You About the Panel |
|---|---|---|
| X-Axis | Hertz (Hz) | The pitch of the sound (low engine rumble vs. high air hiss). |
| Y-Axis | Decibels (dB) | The exact amount of noise the panel blocks. |
| Plotted Curve | Line connecting data | The performance changes across 18 standard frequency bands. |
What Does an STL Curve Reveal About Marine Accommodation Panel Core Density?
Heavy panels cost more to ship. Weak panels let noise through. The STL curve reveals the truth about a panel's core density and helps you avoid buying bad materials.
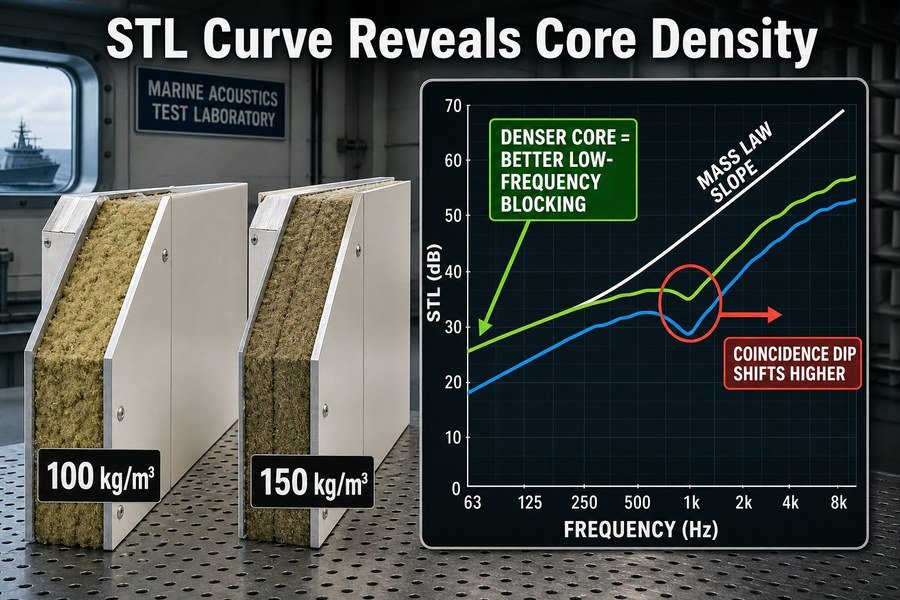
An STL curve reveals marine accommodation panel core density through three indicators: high mass law compliance (steep overall slope), improved low-frequency noise blockage (higher starting dB values), and shifted coincidence dips (weak points moving to higher frequencies as density increases).
High Mass Law Compliance in Marine Panel Cores
The "Mass Law" is a basic rule of acoustics. It states that heavier, denser materials block sound better4. When you look at an STL curve, a steep, upward slope usually means the panel follows this law well. As an outfitting specialist, I look for this slope first. A standard B-15 class marine panel with a heavy density of 120 kg/m³ rockwool core will show a distinct, rising curve. If a supplier claims they gave you a high-density panel, but the curve is flat and stays low on the graph, they are lying. The curve proves the physical mass of the core.
Improved Low-Frequency Noise Blockage from Dense Cores
Low-frequency noise is very hard to block. It comes from the ship's massive engines and propellers. A high-density core handles this much better. You can see this clearly on the far left side of the STL curve. According to the International Maritime Organization (IMO) noise codes, low-frequency performance is critical. If you have a panel with a light 100 kg/m³ density, it might block only 20 dB at 125 Hz. But a denser 150 kg/m³ panel might block 25 dB at the same 125 Hz.5 The higher starting point on the graph reveals a denser, heavier core inside the panel.
Shifted Coincidence Dips Due to Increased Density
Every panel has a weak point called a "coincidence dip." This happens when the sound wave perfectly matches the panel's natural vibration. When the core density goes up, the panel becomes stiffer and much heavier. This changes how the panel vibrates. On the graph, you will see the sudden drop in performance (the dip) move to the right, toward higher frequencies6. A thin, low-density panel might show a dip at 500 Hz. A thick, high-density panel will push that dip to 2000 Hz or higher, safely away from common speech frequencies.
| Core Density Indicator | Visual Proof on STL Curve | Real-World Acoustic Benefit |
|---|---|---|
| High Mass Law Compliance | Steep, upward rising slope. | Overall better noise reduction across the board. |
| Low-Frequency Blockage | Higher decibel starting point at 100 Hz. | Stops deep engine rumble from entering cabins. |
| Shifted Coincidence Dips | Weak point moves to higher frequencies. | Moves panel weaknesses away from human speech range. |
How to Identify a Marine Accommodation Panel's Weakest Frequency Band from Charts?
Hidden acoustic weak points cause failed shipyard inspections. Fixing this later is expensive. You must learn to spot these weak bands on the chart before you place a purchase order.
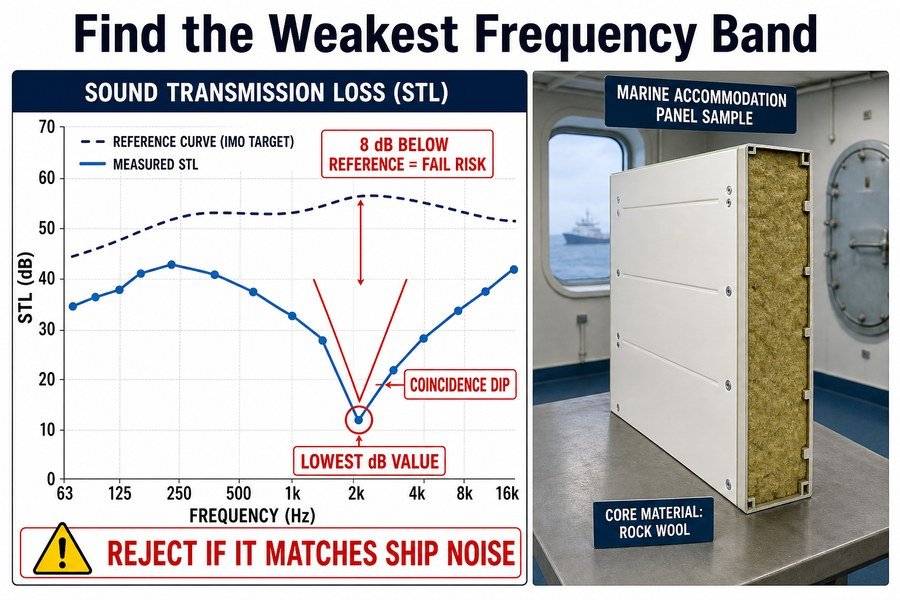
You can identify a marine accommodation panel's weakest frequency band by finding the lowest absolute dB value, locating the coincidence dip (a sudden sharp downward V-shape in the curve), and checking the 8-decibel rule against the standard reference curve.
Finding the Lowest Absolute Decibel Value on the Graph
The simplest way to find the panel's weak spot is to look for the lowest point on the Y-axis. Trace the line on the graph and find exactly where it drops closest to the bottom. For example, a 25mm honeycomb aluminum panel might block 35 dB at most frequencies, but it might only block 18 dB at 250 Hz7. That 18 dB point is the lowest absolute value. It tells you exactly where the panel performs the worst. You must ensure this low point does not match the frequency of the loud equipment near the cabin.
Locating the Coincidence Dip on the STL Curve
The coincidence dip is very easy to spot on the chart. It looks like a sharp "V" shape cutting down into the curve. As sound hits the panel at a specific pitch, the panel bends and lets the noise pass right through8. According to standard acoustic engineering texts, a steel-faced marine panel often has a coincidence dip around 2000 Hz to 2500 Hz9. If you see the line climbing steadily and then suddenly crash downward at 2000 Hz before climbing again, you have found the panel's critical weakness.
Checking the 8-Decibel Rule Against the Reference Curve
International standard ISO 717-1 uses a specific method to rate panels. The testing lab overlays a standard "reference curve" on top of the panel's actual test curve. During this test, the engineers apply a strict 8-decibel rule. If any single frequency band falls 8 dB or more below the standard reference curve, that specific band is severely weak. This is a very strict standard that European shipyards follow closely. If a panel triggers this 8-decibel rule on the chart, it is a weak panel and you should avoid buying it.
| Identification Method | What to Look for on the Chart | Why It Matters for Shipyards |
|---|---|---|
| Lowest Absolute Value | The point closest to the bottom X-axis. | Shows the absolute worst noise blocking point. |
| Coincidence Dip | A sharp, downward V-shape on the line. | Shows where natural vibration causes noise leaks. |
| 8-Decibel Rule | Drops 8 dB below the ISO reference curve. | Causes the panel to fail European certifications. |
Why Might Flat STL Curves Outperform Peaked Ones for Marine Accommodation Panels?
A panel with a huge peak sounds great on paper. But it often fails in real ships. Flat curves are actually safer for keeping passenger cabins quiet and comfortable.
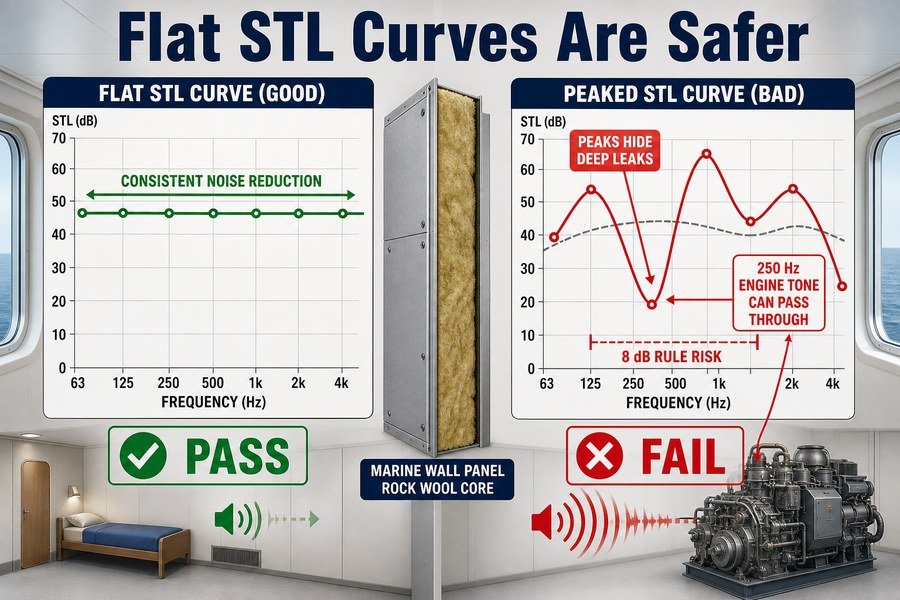
Flat STL curves outperform peaked ones for marine accommodation panels because they offer consistent noise reduction across all pitches, prevent single-frequency noise leakage from ship engines, and ensure stable sound transmission classes (STC) without triggering the 8-decibel failure rule.
Providing Consistent Noise Reduction Across All Pitches
A flat STL curve means the panel blocks sound evenly. It might block 35 dB at low pitches, 36 dB at middle pitches, and 37 dB at high pitches. A peaked curve might block 50 dB at one specific pitch but drop down to only 20 dB everywhere else. Ships are very noisy environments with many different sounds happening at exactly the same time.10 You have engine rumble, HVAC air flow, and people talking. A flat curve handles all of these sounds predictably. You get no nasty surprises when the panel is finally installed on the deck.
Preventing Single-Frequency Noise Leakage from Ship Engines
Marine diesel engines produce very strong, specific noise frequencies.11 Let us say a ship's generator creates massive noise exactly at 250 Hz. If your panel has a peaked curve that dips sharply at 250 Hz, the generator noise will pass straight into the passenger cabin. The room will buzz loudly. According to DNV (Det Norske Veritas) marine standards, ambient noise in passenger cabins must stay below 45 dB(A). A flat curve guarantees that no matter what specific frequency the engine pumps out, the panel has enough mass to stop it.
Ensuring Stable Ratings Without Triggering the 8-Decibel Rule
We talked about the ISO 717-1 standard's 8-decibel rule12 earlier. A peaked curve is very dangerous during testing. Because a peaked curve goes up and down sharply, it creates deep valleys on the graph. These deep valleys can easily fall more than 8 dB below the standard reference curve. If this happens, the panel fails the certification test, or gets a much lower final rating (like dropping from Rw 35 to Rw 30). Flat curves stay close to the reference line. Therefore, flat curves give you stable, certified acoustic ratings that please shipyard buyers.
| Feature of STL Curve | Flat Curve Performance | Peaked Curve Performance |
|---|---|---|
| Noise Reduction Consistency | Even and predictable across all pitches. | Great at one pitch, terrible at others. |
| Engine Noise Leakage | Blocks strong single-frequency sounds safely. | Risks huge noise leaks if engine pitch matches the dip. |
| ISO 8-Decibel Rule Test | Passes easily, maintains high STC/Rw rating. | Often fails, causing the STC/Rw rating to drop. |
How to Match a Ship's Noise Spectrum to a Marine Accommodation Panel STL Curve?
Buying panels without knowing the ship's noise is dangerous. It wastes money and fails inspections. I will show you how to match the panel exactly to the ship's specific noise.
To match a ship's noise spectrum to an STL curve, you must obtain the naval architect's noise prediction report, identify the dominant source frequencies (engines or HVAC), and select a panel whose highest decibel blocking values align exactly with those dominant noise peaks.
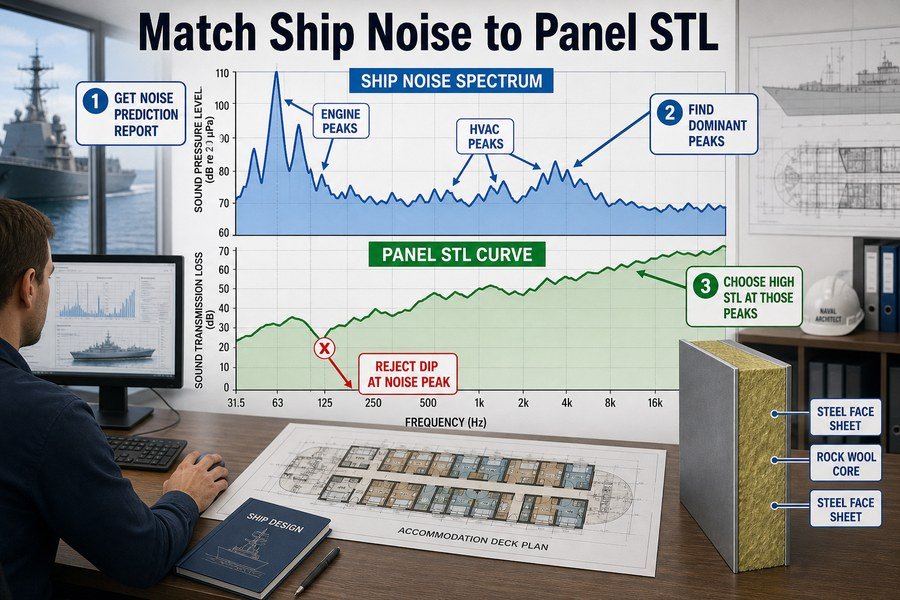
You cannot guess the noise of a ship. Every ship is different. Before you buy marine interior panels, you must ask the shipyard for the noise prediction report. The naval architects write this report during the ship's early design phase. It calculates the expected noise in every single room. According to IMO Resolution MSC.337(91), this calculation is a strict legal requirement for new commercial ships. This report will give you a clear graph showing how loud the noise will be at different frequency bands in the specific cabin you are outfitting.
Identifying Dominant Source Frequencies Like Engines or HVAC
Once you have the noise prediction report, look for the highest spikes in noise. These are your dominant source frequencies. If you are outfitting a cabin right above the main engine room, the report will show huge noise spikes between 63 Hz and 250 Hz.13 This is low-frequency rumble. If you are outfitting a cabin near a massive HVAC fan room, the noise spikes will be much higher, around 1000 Hz to 2000 Hz. You must know exactly what pitch is causing the biggest problem before you choose a marine wall panel.
Aligning Panel Decibel Blocking Values with Noise Peaks
Now you must compare the ship's noise graph to the panel's STL curve graph. You must match them up perfectly. If the ship's noise peaks heavily at 500 Hz, you must look at the panel's STL curve specifically at 500 Hz. You want to choose a panel that has a very high dB blocking value at that exact 500 Hz mark. If the panel's coincidence dip (its weakest point) sits at 500 Hz, you must reject that panel immediately.14 You must align the panel's strength with the ship's weakness to ensure a quiet cabin.
| Matching Step | Action Required | Source Document Needed |
|---|---|---|
| Step 1: Obtain Report | Get the calculated cabin noise levels. | Naval Architect Noise Prediction Report. |
| Step 2: Identify Peaks | Find the loudest specific pitch in the cabin. | Noise prediction graph. |
| Step 3: Align Values | Match the loud pitch to a high point on the STL. | Panel supplier's acoustic test report. |
What Frequency Range Must a Reliable Marine Accommodation Panel STL Curve Cover?
Cheap suppliers send test reports with missing data. This tricks you into buying bad panels. You must demand test reports that cover the exact legal frequency range every single time.
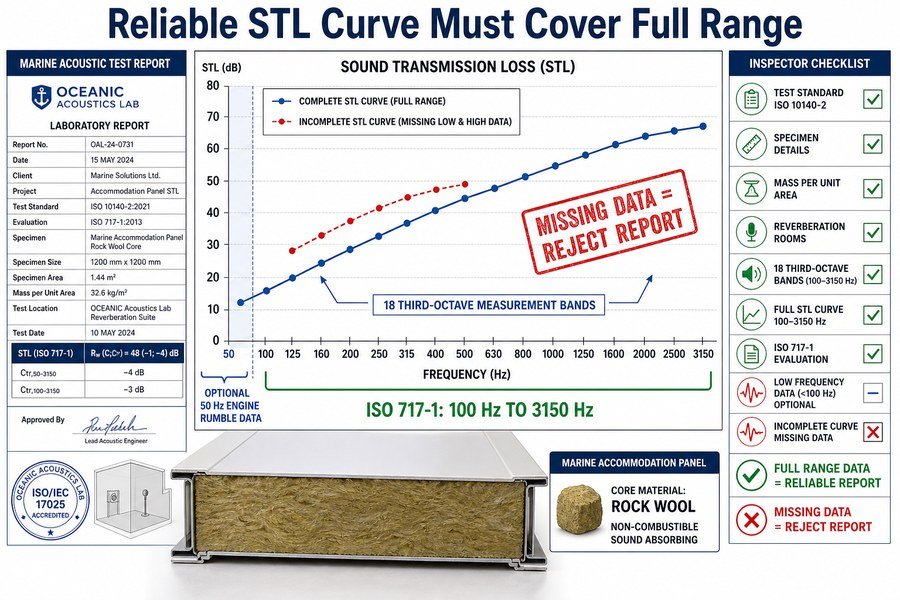
A reliable marine accommodation panel STL curve must cover the ISO 717-1 mandated range from 100 Hz to 3150 Hz, include optional extended low frequencies down to 50 Hz for engine rooms, and display 18 distinct third-octave measurement bands to be legally accepted by marine classification societies.
The Mandated ISO 717-1 Range from 100 Hz to 3150 Hz
If a supplier gives you an acoustic test report, look at the bottom X-axis immediately. To meet international standards, specifically ISO 717-1, the STL curve must start at exactly 100 Hz and end at exactly 3150 Hz. This is non-negotiable. This standard range covers the most common sounds heard by the human ear. It covers the deep hum of machinery and the high pitch of voices. If a supplier gives you a report that only covers 250 Hz to 2000 Hz, throw it away. European shipyards will not accept it.
Including Optional Extended Low Frequencies Down to 50 Hz
While 100 Hz is the standard starting point, modern ships have very powerful diesel engines. These engines create deep, low-frequency vibrations15 that easily pass through thin cabin walls. For critical areas, like the engine control room or cabins directly above the thrusters, marine classification societies like ABS (American Bureau of Shipping) or Lloyd's Register may request extra data. They will want to see the STL curve extended down to 50 Hz. Testing down to 50 Hz is harder for the factory, but it proves the panel can stop serious engine rumble.
Displaying 18 Distinct Third-Octave Measurement Bands
The space between 100 Hz and 3150 Hz is not just a straight, empty line. The testing lab must measure the noise reduction at 18 specific, standardized points16. These are called third-octave bands. The points include 100, 125, 160, 200, 250, 315, 400, 500, 630, 800, 1000, 1250, 1600, 2000, 2500, and 3150 Hz. Your STL graph must clearly show data for all 18 points. If the graph only shows 5 or 6 points, the supplier used cheap testing methods. This lacks detail and hides dangerous acoustic weak spots.
| Required Data Point | Value / Range | Why Classification Societies Demand It |
|---|---|---|
| ISO Standard Range | 100 Hz to 3150 Hz | Covers the full spectrum of normal human hearing. |
| Extended Low Range | Down to 50 Hz | Proves performance against extreme engine vibrations. |
| Measurement Points | 18 third-octave bands | Prevents factories from hiding narrow weak spots. |
Conclusion
Understanding STL curves is essential for buying the right marine panels. By analyzing frequency ranges, core densities, and noise peaks, you guarantee quiet cabins and pass shipyard inspections smoothly.
-
"[PDF] Third Octave Acoustic Noise Spectrum Analysis", https://ntrs.nasa.gov/api/citations/19670006729/downloads/19670006729.pdf. Acoustic sound insulation ratings under ISO 717-1 are commonly derived from one-third-octave band values across the 100 Hz to 3150 Hz range, which corresponds to 18 standard center-frequency bands. Evidence role: definition; source type: institution. Supports: The graph axis contains 18 standard one-third-octave frequency bands from 100 Hz to 3150 Hz.. Scope note: This supports the conventional ISO 717-1 one-third-octave rating range, not every possible acoustic test configuration or extended-frequency measurement. ↩
-
"[PDF] Methods for determining sound transmission loss in the field", https://nvlpubs.nist.gov/nistpubs/jres/26/jresv26n5p419_A1b.pdf. Acoustics references define sound transmission loss as a decibel measure comparing incident sound power with transmitted sound power through a partition or element. Evidence role: definition; source type: education. Supports: Sound Transmission Loss is measured in decibels and describes how much sound is reduced through a panel.. Scope note: This definition describes the laboratory quantity; field sound reduction can differ because of flanking paths, room absorption, and installation conditions. ↩
-
"[PDF] Methods for determining sound transmission loss in the field", https://nvlpubs.nist.gov/nistpubs/jres/26/jresv26n5p419_A1b.pdf. In decibel calculations, a transmission loss value is subtracted from the incident sound level to estimate the transmitted level under simplified single-path conditions. Evidence role: mechanism; source type: education. Supports: A 35 dB transmission loss can be used to estimate a reduction from 90 dB to 55 dB in a simplified example.. Scope note: The 55 dB result is an idealized estimate; actual cabin levels may vary with source spectrum, reverberation, flanking transmission, leaks, and installation quality. ↩
-
"Sound transmission properties of mineral-filled high-density ...", https://bioresources.cnr.ncsu.edu/resources/sound-transmission-properties-of-mineral-filled-high-density-polyethylene-hdpe-and-wood-hdpe-composites/. A standard acoustics reference on the mass law of sound insulation supports that transmission loss for a barrier generally increases with surface mass and frequency. Evidence role: definition; source type: education. Supports: The mass law states that heavier, denser materials block sound better.. Scope note: This is contextual support; mass law is based on surface density and idealized panel behavior, not core density alone in a composite marine panel. ↩
-
"[PDF] optimizing sandwich panels with graded tubular cell core for ... - arXiv", https://arxiv.org/pdf/2401.11412. Laboratory STL data or peer-reviewed measurements of mineral-wool or marine sandwich panels can support whether increasing core density is associated with higher transmission loss at 125 Hz. Evidence role: statistic; source type: paper. Supports: A 100 kg/m³ core may provide about 20 dB STL at 125 Hz, while a 150 kg/m³ core may provide about 25 dB at the same frequency.. Scope note: The figures would be representative only for the tested panel construction, thickness, facings, mounting conditions, and laboratory method; they should not be generalized to all marine panels. ↩
-
"[PDF] Sound Transmission Loss of Composite Sandwich Panels", https://etd.auburn.edu/bitstream/10415/1702/3/Ran%20Zhou_Dissertation.pdf. Architectural-acoustics literature on coincidence frequency explains that panel transmission loss can show a coincidence dip whose frequency depends on mass, bending stiffness, and panel construction. Evidence role: mechanism; source type: education. Supports: Increasing core density changes panel vibration behavior and can shift the coincidence dip toward higher frequencies.. Scope note: This supports the mechanism and relevant variables, but it may not prove that increasing core density alone always shifts the dip to higher frequencies in marine composite panels. ↩
-
"[PDF] Modal analysis and acoustic transmission through offset-core ...", https://louis.uah.edu/cgi/viewcontent.cgi?article=1089&context=uah-theses. A laboratory sound-transmission-loss report or peer-reviewed sandwich-panel study can document frequency-dependent STL values for honeycomb aluminum panels and show whether low-frequency bands such as 250 Hz can be substantially weaker than mid- or high-frequency bands. Evidence role: case_reference; source type: paper. Supports: A 25 mm honeycomb aluminum panel may have much lower sound transmission loss at a specific low-frequency band, such as 250 Hz, than at most other frequencies.. Scope note: The cited values will apply only to the tested panel construction, boundary conditions, and measurement standard; they should not be treated as universal values for all 25 mm honeycomb aluminum panels. ↩
-
"[PDF] Extraction of plate bending stiffness from coincidence angles of sound ...", https://physics.byu.edu/docs/publication/2624. Acoustics references describe the coincidence effect as occurring when a panel’s bending-wave speed matches the airborne sound-wave trace speed, reducing sound insulation near the critical frequency. Evidence role: mechanism; source type: education. Supports: At a particular frequency range, bending waves in a panel can couple efficiently with airborne sound and reduce sound insulation.. Scope note: This explains the physical mechanism generally; the severity and frequency of the dip depend on material properties, thickness, mounting, damping, and angle of incidence. ↩
-
"Sound Transmission Loss of Composite Sandwich Panels", https://etd.auburn.edu/bitstream/10415/1702/3/Ran%20Zhou_Dissertation.pdf. Published acoustics data or engineering references can show typical critical-frequency ranges for steel sheet or steel-faced sandwich panels, providing context for coincidence dips in the 2–2.5 kHz region. Evidence role: general_support; source type: paper. Supports: Steel-faced marine or sandwich panels can exhibit a coincidence-related dip in the approximate 2000–2500 Hz range.. Scope note: The frequency range is not fixed for all steel-faced marine panels; it varies with face-sheet thickness, core stiffness, damping treatment, mounting, and test configuration. ↩
-
"Discussion Paper Noise", http://maritime.lamar.edu/joomla2025/index.php/ergonomics?download=66:ergonomic-discussion-paper-noise. Maritime noise studies describe shipboard sound fields as mixtures of machinery, ventilation, hydrodynamic, and human-activity sources, supporting the general claim that vessels contain multiple simultaneous noise sources. Evidence role: general_support; source type: paper. Supports: Ships are acoustically complex environments with multiple simultaneous noise sources.. Scope note: Such sources and levels vary substantially by vessel type, operating condition, and location onboard. ↩
-
"[PDF] Vibration Diagnostics Methods of Marine Diesel Engines with ... - NATO", https://publications.sto.nato.int/publications/STO%20Meeting%20Proceedings/STO-MP-AVT-306/MP-AVT-306-09.pdf. Research on marine diesel engine acoustics identifies tonal components associated with firing orders, rotational speed, and engine harmonics, supporting the statement that such engines can generate strong discrete-frequency noise. Evidence role: mechanism; source type: paper. Supports: Marine diesel engines can generate strong discrete or tonal noise frequencies.. Scope note: The exact frequencies and amplitudes depend on engine design, speed, mounting, load, and surrounding structure. ↩
-
"Analysis between weighted sound reduction index according to ISO ...", https://www.academia.edu/21437199/Analysis_between_weighted_sound_reduction_index_according_to_ISO_717_1_and_indices_according_to_ISO_16717_1. ISO 717-1 defines single-number airborne sound-insulation ratings by fitting a reference curve to measured third-octave-band values and applying limits to unfavorable deviations, including an 8 dB single-band constraint in commonly used rating procedures. Evidence role: definition; source type: institution. Supports: ISO 717-1 uses an 8 dB unfavorable-deviation rule in determining airborne sound-insulation ratings such as Rw.. Scope note: The ISO text is usually paywalled, so secondary summaries should be checked against the current official edition before quoting the rule precisely. ↩
-
"Quarter-wavelength acoustic resonators for ship machinery ...", https://ui.adsabs.harvard.edu/abs/2026OcEng.34323261V/abstract. Marine-noise studies identify propulsion and machinery sources as important contributors to low-frequency shipboard noise, which provides contextual support for expecting engine-room-adjacent cabins to show elevated levels in low-frequency bands such as 63–250 Hz. Evidence role: mechanism; source type: paper. Supports: Cabins near main engine rooms commonly experience dominant low-frequency noise components around 63–250 Hz.. Scope note: The exact frequency-band levels vary with engine type, mounting, hull structure, insulation, and room location; a source is unlikely to prove this range for every ship. ↩
-
"[PDF] Sound Transmission Loss of Composite Sandwich Panels", https://etd.auburn.edu/bitstream/10415/1702/3/Ran%20Zhou_Dissertation.pdf. Building-acoustics references describe the coincidence effect as a frequency region where a panel’s sound transmission loss can drop, supporting the need to compare a panel’s STL curve with the dominant noise spectrum when selecting partitions. Evidence role: mechanism; source type: education. Supports: A panel with a coincidence dip at a dominant noise frequency may perform poorly for that cabin and should be avoided or redesigned.. Scope note: The source would support the acoustic mechanism and selection logic, but the absolute instruction to reject a panel depends on the required cabin noise target, installation details, and available mitigation layers. ↩
-
"vibration of marine diesel engine foundation - Academia.edu", https://www.academia.edu/5180778/VIBRATION_OF_MARINE_DIESEL_ENGINE_FOUNDATION. Research on shipboard noise and vibration identifies diesel engines, propulsion systems, and thrusters as important sources of low-frequency structure-borne and airborne noise in vessels. Evidence role: mechanism; source type: paper. Supports: Modern ship engines and propulsion equipment generate low-frequency vibration and noise that can transmit through ship structures.. Scope note: This supports the physical mechanism and source category, but it does not establish the performance of any specific panel or wall assembly. ↩
-
"ISO 266:1997(en), Acoustics — Preferred frequencies", https://www.iso.org/obp/ui/en/#!iso:std:1350:en. ISO 717-1 and preferred-frequency standards define standardized one-third-octave centre frequencies for sound-insulation assessment; the commonly cited 100 Hz to 3150 Hz sequence contains 16 centre frequencies, not 18. Evidence role: definition; source type: institution. Supports: Sound-insulation measurements use standardized one-third-octave centre-frequency bands, and the 100 Hz to 3150 Hz ISO range has a defined set of centre frequencies.. Scope note: The source would support the standardized-band concept while indicating that the article’s stated count may need correction or explanation if additional bands are intended. ↩